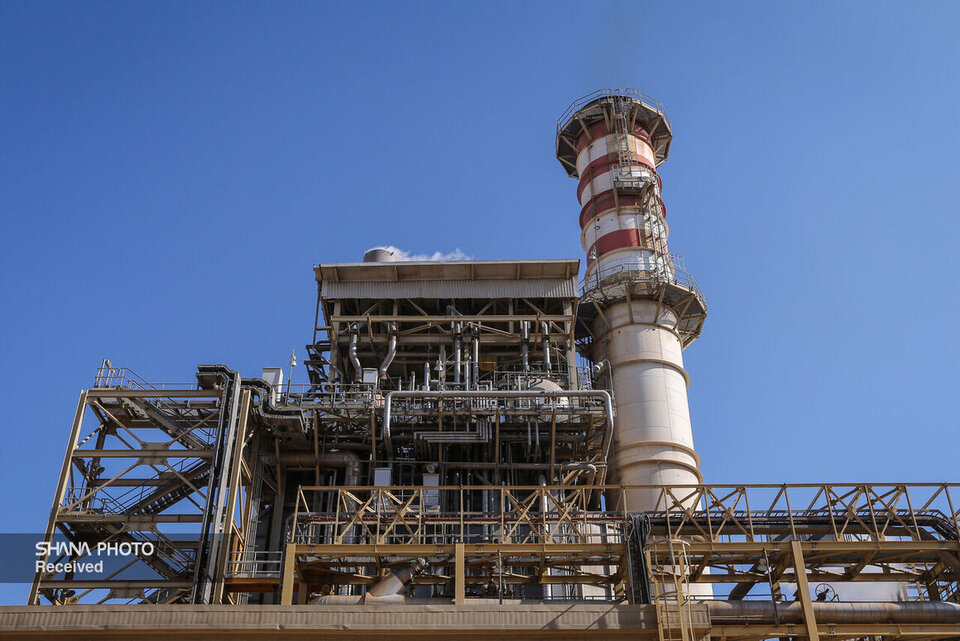
Data from Sept. 6–12 show power plants remained the top consumers, using more than 2.165 billion cubic meters of gas during the week. The household, commercial and small industry sector followed with over 1.17 billion cubic meters, while major industries consumed about 1.153 billion cubic meters.
Daily breakdown of gas consumption:
Saturday, Sept. 6: Power plants 306.60 mcm, major industries 162.97 mcm, households/commercial/small industries 160.97 mcm. Total: 630.54 mcm.
Sunday, Sept. 7: Power plants 312.58 mcm, major industries 162.19 mcm, households/commercial/small industries 175.57 mcm. Total: 650.34 mcm.
Monday, Sept. 8: Power plants 305.46 mcm, major industries 163 mcm, households/commercial/small industries 173.69 mcm. Total: 642.15 mcm.
Tuesday, Sept. 9: Power plants 329 mcm, major industries 162.85 mcm, households/commercial/small industries 164.78 mcm. Total: 656.63 mcm.
Wednesday, Sept. 10: Power plants 310.24 mcm, major industries 167.53 mcm, households/commercial/small industries 166.65 mcm. Total: 644.42 mcm.
Thursday, Sept. 11: Power plants 303.36 mcm, major industries 167.52 mcm, households/commercial/small industries 174.32 mcm. Total: 645.20 mcm.
Friday, Sept. 12: Power plants 297.93 mcm, major industries 167.04 mcm, households/commercial/small industries 154.13 mcm. Total: 619.10 mcm.
The report shows power plants averaged more than 309 million cubic meters per day, keeping them the country’s main gas consumers. Consumption in the household, commercial and small industry sector fluctuated more than in major industries.


Your Comment